ENVIRONMENT
The Keeling Curve
1958 CE
History · Contemporary · Holocene · Meghalayan
Since 1958, Charles David Keeling's measurements at Mauna Loa, in Hawaii, have recorded the rise of carbon dioxide in the atmosphere, from 315 to about 430 parts per million.
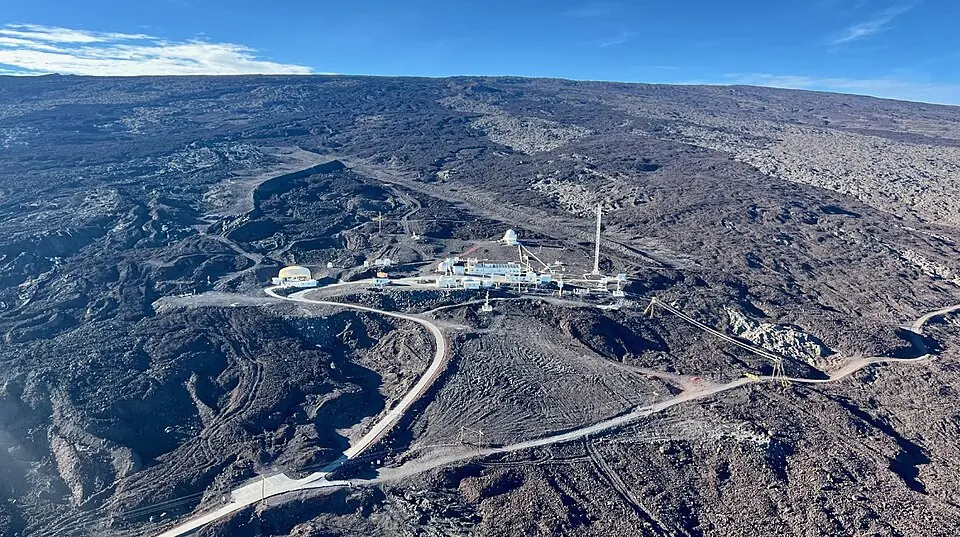
The Keeling curve is the continuous series of atmospheric carbon dioxide measurements begun in 1958 by Charles David Keeling at the Mauna Loa Observatory in Hawaii, at about 3,400 metres. The choice of site conditions the measurement. Near a city, a factory or a forest, the concentration varies from hour to hour with nearby sources, and one then measures a local environment rather than a planet; what is needed is air that has travelled long over the ocean, sampled at altitude and away from any source, conditions the summit of Mauna Loa satisfies. Within two years the series reveals a seasonal oscillation, the concentration falling each boreal summer through photosynthesis in continental forests, and, in the Antarctic measurements, a steady rise. The concentration has moved from 315 to about 430 parts per million.
Why it matters
The series constitutes the reference direct measurement of the increase in atmospheric carbon dioxide, to which climate models and the numerical commitments of international agreements refer. It also documents a form of scientific production distinct from the isolated discovery: a result obtained through the continuity of instrumental monitoring, whose funding has repeatedly been threatened and which no reconstruction can replace.
Dating & uncertainty
Measurements begin in 1958 and have not been interrupted since. Keeling reports within two years the seasonal oscillation of the northern hemisphere and, in Antarctica, a small but persistent rise.
Our species’ history as one day
23:59:4118.7 s before midnight
if the 315,000 years of Homo sapiens were compressed into a single day