CLIMATE × TECHNOLOGY
The Keeling Curve
1958 to 2016 CE
Phanerozoic · Cenozoic · Quaternary · Holocene · Meghalayan
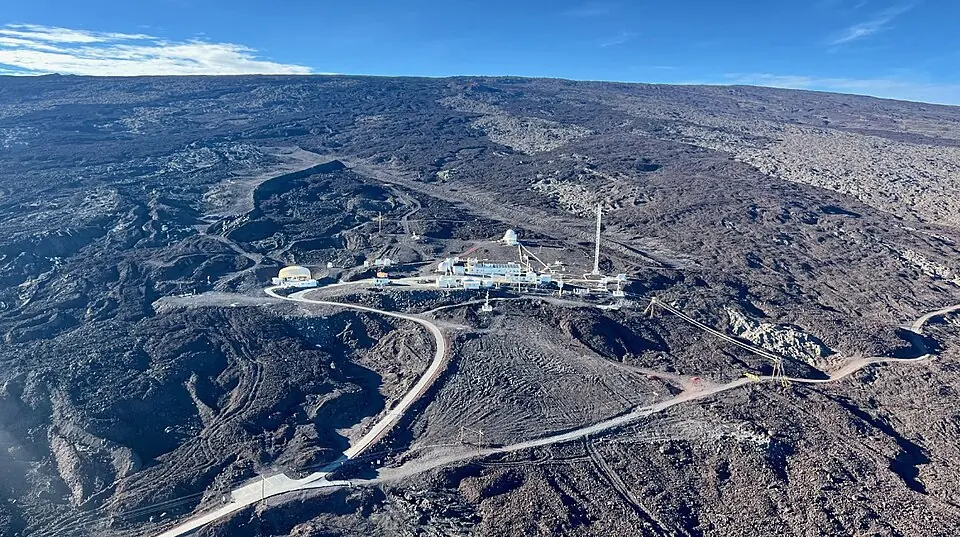
The Keeling curve is the series of carbon dioxide concentrations in the atmosphere read from one instrument at Mauna Loa, in Hawaii, without interruption since 1958, and it rises every year.
The Keeling curve is the series of carbon dioxide measurements read from one instrument at the Mauna Loa observatory, in Hawaii, without interruption since 1958. It replaced an argument about carbon dioxide with a measurement. The curve rises every year. Within each year it also falls and rises again, as the northern forests come into leaf and then shed their leaves. This yearly swing is the seasonal respiration of the continental biosphere, the living things of the land. The annual mean passed 400 parts per million in 2016, that is, 400 molecules of carbon dioxide per million molecules of air.
Why it matters
The carbon dioxide values cited today come from a series that people began by hand, defended against funding reductions and maintained for sixty years without being able to know its result. The annual oscillation shows the vegetation of the whole northern hemisphere as a variation of a single curve.
Dating & uncertainty
The measurement comes from a single station, Mauna Loa, where it began in 1958 and has not been interrupted. The rise is nevertheless more than a local effect: Keeling's first readings already identified a small and persistent rise in Antarctica. The annual mean passed 400 parts per million in 2015 and 2016. The atmosphere last reached that level several million years ago.
Earth history as one day
23:59:59.99871.3 ms before midnight
if Earth’s 4.54 billion years were compressed into a single day