Past climates· Under the timeline
The Earth's climate since its formation
4.54 Ga → Today
Under the Deep Time timeline, two colour bands represent how the global mean temperature and the amount of CO₂ (carbon dioxide) in the atmosphere have changed since the formation of the Earth.
Their values come from measurements, published reconstructions, calculations made with mathematical models and, before 4.4 billion years ago, the state of the surface as described in published studies.
01What the colours and patterns mean
The upper band represents the global mean temperature by its difference from the average of the years 1850-1900, the period the IPCC, the United Nations panel of climate experts, uses to represent the climate before industrialisation. A difference of zero corresponds to about 14 °C, from figures published by Jones and colleagues in 1999 1. The lower band represents the amount of CO₂ in the atmosphere, in multiples of its 1850-1900 level.
Blues denote a world colder than in 1850-1900, oranges a warmer one, and black, in the middle of the bar, a difference of zero. The colours change more per degree where the difference is small, so a change of one degree in our own time stands out as clearly as a change of ten degrees in the Cretaceous, 143 to 66 million years ago.
Band split in two: two estimates for the same dates, one in the top half and one in the bottom half. On four stretches, these are two studies of the global mean temperature whose values differ, each read against the colour bar. On the fifth, 3.5 to 3.2 billion years ago, the bottom half represents another quantity, the temperature of seawater. It is estimated at 55 to 100 °C from cherts, rocks made of silica that formed in marine sediments and whose oxygen composition depends on the temperature of the water, provided that seawater then had the same composition as today 2, 3, 4; two other studies put it below 40 °C 5, 6. Too hot for the bar, this half is marked above the scale. When the pointer is over the band, or when the band is tapped, a panel opens and displays both values, each with the name of its study.
Hatching: a temperature calculated by a mathematical model, that is, equations that a computer program solves to simulate how the climate changed (see 'More than 539 million years ago'). The mathematical model is run a great many times, with different settings: the band represents the central value of these runs, and the hatching indicates how widely they spread. Sparse hatching: at a given date, 95% of the results fall within an interval of less than 10 degrees. Dense hatching: they spread over more than 10 degrees, and the temperature represented is less certain.
White dots: a glaciation, a cold period when glaciers spread over vast areas. The two bands mark in this way only the glaciations older than 539 million years, whose dates and sources the last table of this fiche lists: the mathematical model of Krissansen-Totton and colleagues 7, the source of the values for those times, does not simulate glaciations, and the bands then display none of its values. More recent glaciations, such as the last glacial period, can be read in the blues of the reconstructions. During the two snowball Earth episodes, 717 to 660 and then 639 to 635 million years ago, glaciers reached the sea as far as the equator; two mathematical models of the climate of an ice-covered Earth estimate the global mean temperature at below −50 °C at the coldest point 8, 9, far below the bottom of the scale.
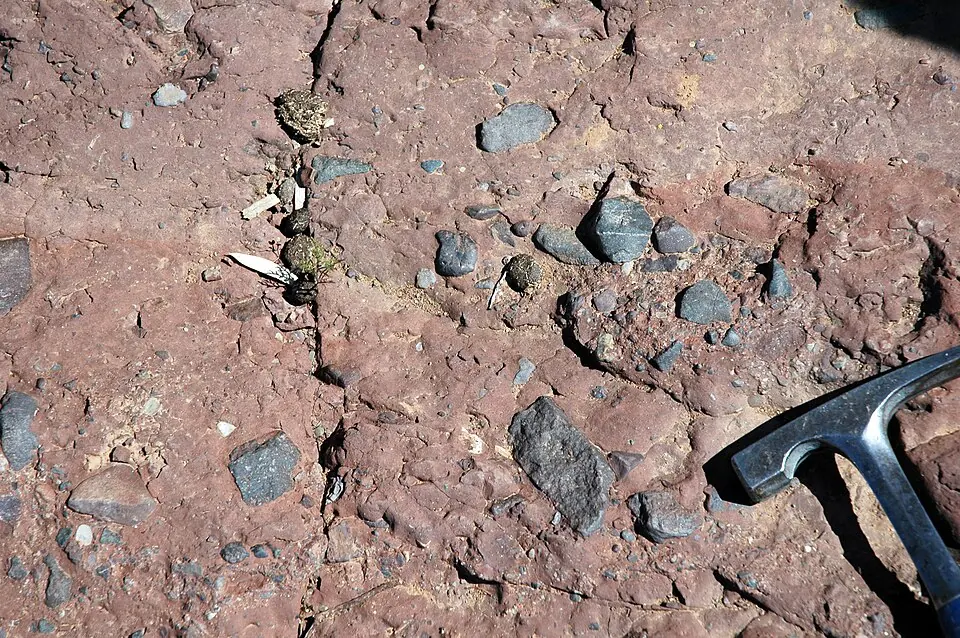
Plain red-orange: a molten surface. Paler while the Earth was forming, when each large impact melted its surface for a time; solid afterwards, when an ocean of magma covered the whole planet (see 'More than 539 million years ago').
Orange edged with white at the top: a temperature above the scale, more than 24 degrees above the 1850-1900 average. The band indicates two: the surface, at 200 to 230 °C, after the ocean of magma, and the seawater, at 55 to 100 °C according to the cherts, a disputed estimate, 3.5 to 3.2 billion years ago.
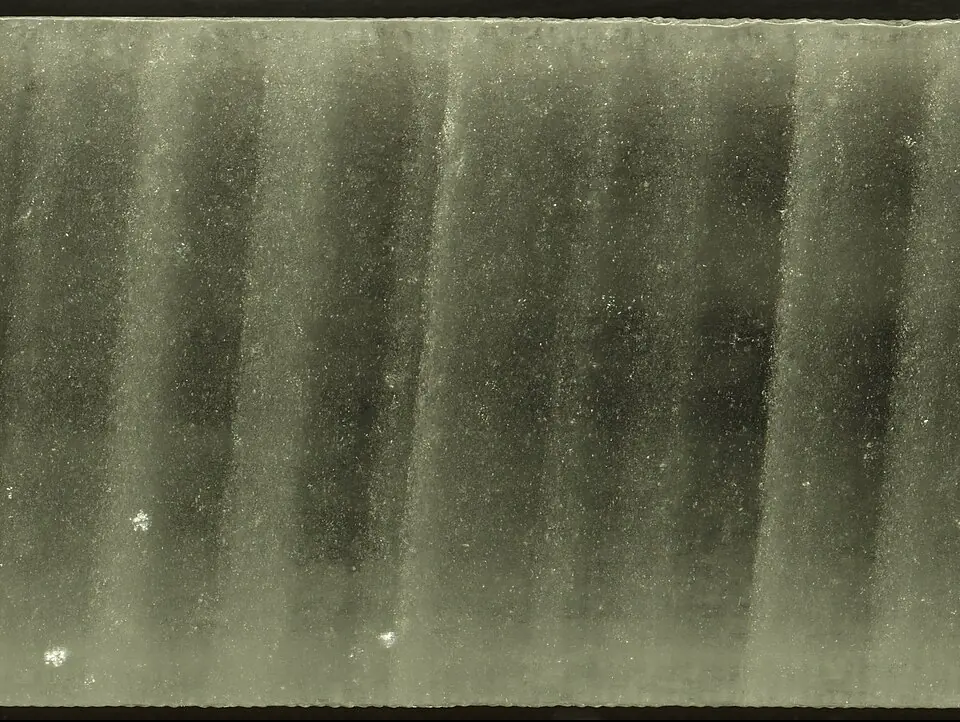
In the timeline's colour key, the CO₂ scale is marked in multiples of the 1850-1900 level: the air then held, on average, 289 molecules of CO₂ in every million molecules of air, according to the air trapped in Antarctic ice 10. The scale is logarithmic: the distance from × 1 to × 10 is the same as from × 10 to × 100. Its marks and colours extend from the lowest to the highest CO₂ level in the part of the timeline on screen, so the same colour stands for a different amount from one view to the next, whereas the temperature colours never change. Before 539 million years ago, the multiple applies to the pressure of the CO₂, compared with its pressure in 1850-1900; the two multiples coincide only if the atmosphere of those times exerted, as today, a pressure of about 1 bar (see 'Two units for CO₂').
02Where the values come from
For each stretch of the timeline, the bands rely on one study, or on two, one above the other, where two studies cover the same dates. Where two stretches meet, the colour changes at once: each study keeps its own values. The IPCC does the same in a figure of its sixth report, published in 2021, that represents how the temperature of the globe changed in the past. Temperatures published in degrees Celsius are converted into differences from the 1850-1900 average, and the mathematical model of Krissansen-Totton and colleagues was run for this timeline (see 'More than 539 million years ago').
The tables distinguish two ways of obtaining a value. A reconstruction starts from evidence measured in natural archives, rocks, fossils, sediments or ice, whose composition depends on the temperature or CO₂ of their time; some, such as those of Osman and of Judd, combine this evidence with a mathematical model of the climate to go from a few places to the global mean. A mathematical model, by contrast, calculates temperature and CO₂ from equations that describe the exchanges of carbon between the air, the ocean and the rocks, where evidence is lacking. A mathematical model, that of Berner and Kothavala 11, also provides the CO₂ from 539 to 420 million years ago, for lack of estimates drawn from fossils for that period. The studies behind each stretch are named in the tables that follow, from the oldest to the most recent, then those that date the glaciations.
| Period | Source | Kind |
|---|---|---|
| 4.54 to 4.48 billion years ago | Nikolaou 201912 | state described in studies: surface melted by each large impact |
| About 4.48 billion years ago | Zahnle 200713 and 201514 | state described in studies: ocean of magma |
| 4.48 to 4.47 billion years ago | Zahnle 200713, Kadoya 202015 | state described in studies: surface at 200 to 230 °C, under about 100 bar of CO₂ |
| 4.47 to 4.4 billion years ago | Zahnle 200713, Kadoya 202015 | state described in studies: cooling, of uncertain length, represented by a gradient |
| 4.4 to 4 billion years ago | Kadoya 202015 | mathematical model |
| 4 to 3.5 billion years ago | Krissansen-Totton 20187 | mathematical model |
| 3.5 to 3.2 billion years ago | top halfKrissansen-Totton 20187 | mathematical model |
| bottom halfKnauth and Lowe 20032, Lowe 20203, McGunnigle 20224; cooler seawater, below 40 °C, according to Hren 20095, Blake 20106 | seawater, from cherts | |
| 3.2 billion to 538.8 million years ago | Krissansen-Totton 20187 | mathematical model |
| 538.8 to 486.85 million years ago | Scotese 202116 | reconstruction |
| 486.85 to 66 million years ago | top halfScotese 202116 | reconstruction |
| bottom halfJudd 202417 | reconstruction | |
| 66 to 5.33 million years ago | top halfWesterhold 202018 | reconstruction |
| bottom halfJudd 202417 | reconstruction | |
| 5.33 to 2 million years ago | Judd 202417 | reconstruction |
| 2 million to 24,000 years ago | Snyder 201619 | reconstruction |
| 24,000 to 12,000 years ago | top halfOsman 202120 | reconstruction |
| bottom halfSnyder 201619 | reconstruction | |
| 12,000 to 2,000 years ago | top halfOsman 202120 | reconstruction |
| bottom halfKaufman 202021 | reconstruction | |
| 1 CE to 1849 | PAGES 2k 201922 | reconstruction |
| 1850 to 2025 | Morice 202123 | measurements |
| Period | Source | Kind |
|---|---|---|
| 4.48 to 4.47 billion years ago | Zahnle 200713 | state described in studies: surface at 200 to 230 °C, under about 100 bar of CO₂ |
| 4.47 to 4.4 billion years ago | Zahnle 200713, Kadoya 202015 | state described in studies: fall in CO₂, of uncertain length, represented by a gradient |
| 4.4 to 4 billion years ago | Kadoya 202015 | mathematical model |
| 4 billion to 538.8 million years ago | Krissansen-Totton 20187 | mathematical model |
| 538.8 to 419.5 million years ago | Berner and Kothavala 200111 | mathematical model |
| 419.5 to 66 million years ago | Foster 201724 | fossils and ancient soils |
| 66 million to 800,000 years ago | CenCO2PIP 202325 | fossils and ancient soils |
| 800,000 years ago to 1958 | Bereiter 201510 | air trapped in ice |
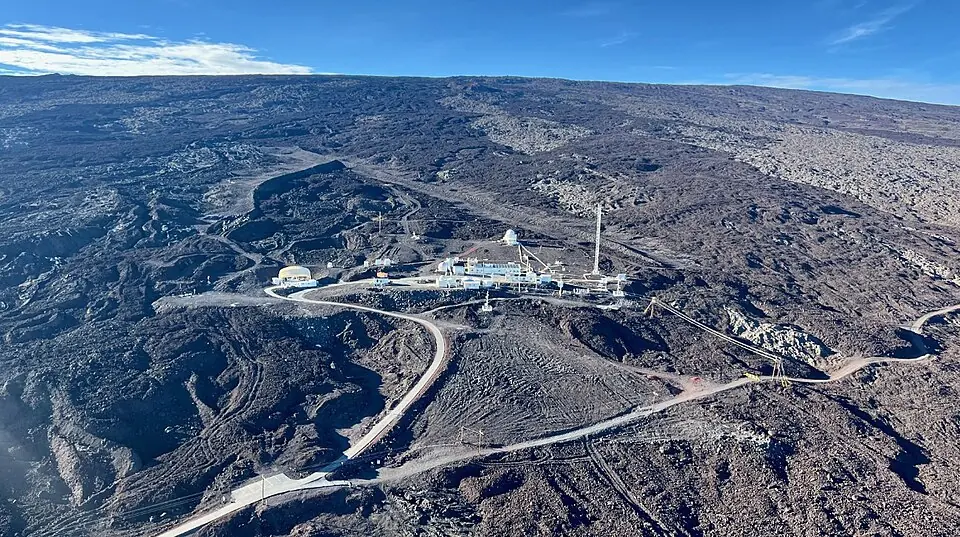
| 1959 to 2025 | NOAA 202626 | measurements |
| Period | Source | Glaciation |
|---|---|---|
| About 2.9 billion years ago | Young 199827 | Pongola glaciation |
| 2.45 to 2.22 billion years ago | Rasmussen 201328, Kasting and Ono 200629 | Huronian glaciations |
| 717 to 660 million years ago | Hoffman 201730 | Sturtian glaciation |
| 639 to 635 million years ago | Hoffman 201730 | Marinoan glaciation |
| About 580 million years ago | Pu 201631 | Gaskiers glaciation |
03More than 539 million years ago
The reconstructions of the global mean temperature selected for this timeline stop at the start of the Cambrian, 539 million years ago. For older times, the two bands first represent the state of the surface as described in published studies, then the results of two mathematical models, which calculate the exchanges of carbon between the air, the ocean and the rocks. Rain slowly breaks down rocks, and this weathering removes CO₂ from the air, while volcanoes release it. CO₂ keeps in part of the heat that the Earth radiates towards space, so the more of it the air holds, the warmer the surface.
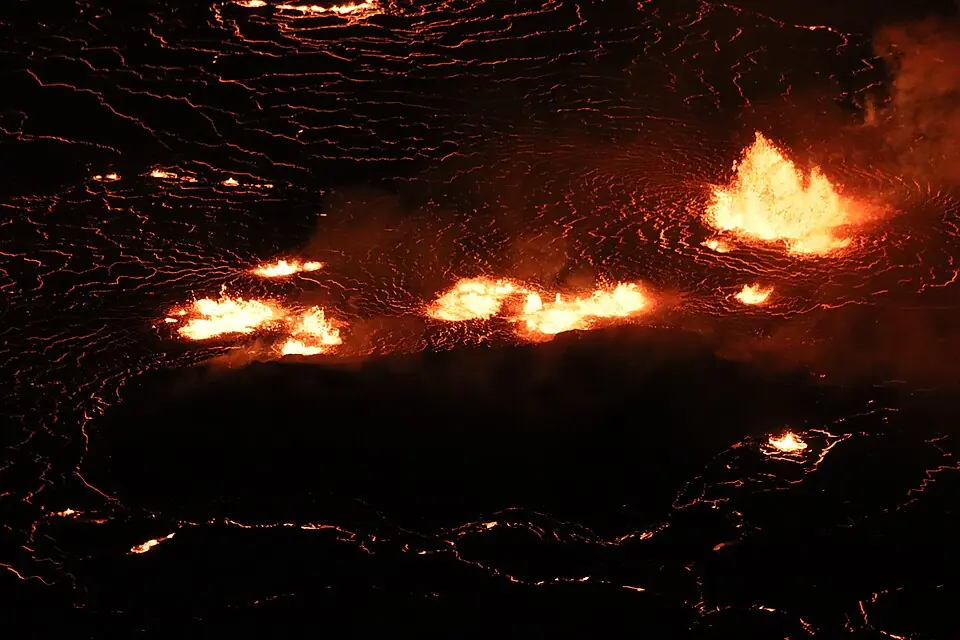
While the Earth was forming, its surface melted with each large impact 12. Then the young Earth collided with another young planet, and the debris from this impact formed the Moon. The collision melted the whole surface, covered for 2 to 10 million years by an ocean of magma 13, 14; the temperature band represents both states in plain red-orange.
Once the ocean of magma had solidified, the surface stayed at 200 to 230 °C 13, 15. The atmosphere was then made mostly of CO₂, at a pressure of about 100 bar, a hundred times the pressure of the air at ground level today 13; the CO₂ band begins with this state. The surface then cooled as the CO₂ in the air dissolved in the ocean and was fixed in the rocks of the sea floor: in 10 million years if the sea floor carried almost all of this carbon deep down, in several tens of millions of years otherwise 13, 15. Since that length is not settled, the two bands represent the cooling by a gradient up to the first calculated values.
From 4.4 to 4 billion years ago, the bands represent the results published by Kadoya and colleagues in 2020 15. Their mathematical model adds to the processes above the weathering of the debris thrown out by meteorite impacts, which also removes CO₂ from the air. From 4 billion to 539 million years ago, the bands represent the results of the mathematical model of Krissansen-Totton and colleagues 7, run 10,000 times for this timeline with the program written by its authors. For each run, the 22 settings of this mathematical model, poorly known quantities on which the result depends, were drawn at random within the limits the authors had set. At each date, the bands represent the central value of these 10,000 results, their median: half of the results are higher, the other half lower.
04Two units for CO₂
For the past 539 million years, the panel that opens over the band expresses the CO₂ in ppm, or parts per million: the number of molecules of CO₂ in every million molecules of air, the quantity measured or estimated by the studies of that period. For older times, it expresses the CO₂ in bar, a unit of pressure, to state the pressure the CO₂ would exert if it were alone in the atmosphere, the quantity that the mathematical models of older times calculate. Converting bar to ppm would mean dividing the pressure of the CO₂ by that of the whole atmosphere, then multiplying by a million; but the pressure of the atmosphere at those times is poorly known, and may have been much higher than today.